
Low Electricity Demand and System Balancing Problems during The UK’s Coronavirus Lockdown
The restrictions on economic and personal activity imposed to address the spread of the coronavirus are reducing electricity demand in the UK to unusually low levels, increasing the difficulties of operating the system, particularly in the presence of embedded solar and wind generation.
As a result of the restrictions on economic activity and personal movement, designed to reduce the rate of transmission of Covid-19, there are striking anomalies in the British electricity markets. The following chart, drawn by the author from BM Reports data, shows daily electrical energy (GWh) transmitted over the network, and gives evidence of a substantial fall in electricity consumption. Domestic consumption may be rising as a result of the Stay at Home policy, but it is nowhere near offsetting the fall in industrial and commercial consumption.
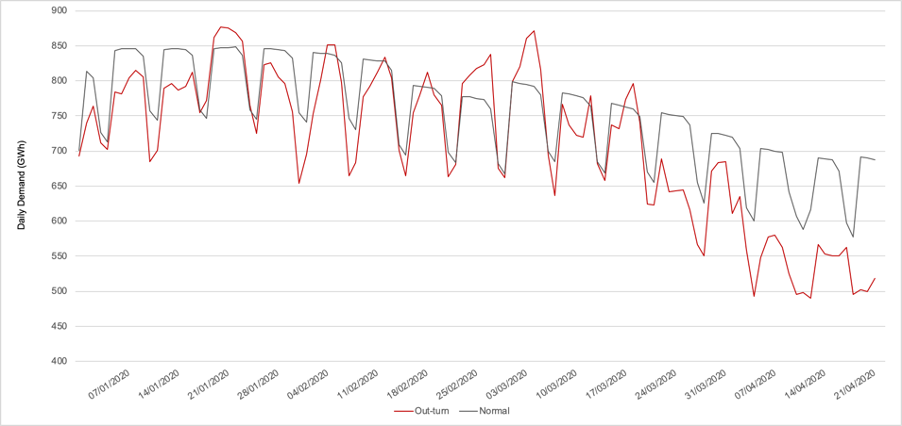
Figure 1: Daily electrical energy (GWh) transmitted over the British electricity network, from 1st of January to 23rd April 2020 (red line), compared to the historical norm (grey line). Source: Chart by the author, data from BM Reports.
Of course, that decline has to be understood against the background of what is normal for the time year, and the grey line shows that demand normally begins to fall from January onwards. The red line shows that this year was no exception, with the decline beginning even in January well before the first warnings about Covid-19 were given. Furthermore, demand was already low relative to the historical norm for these months, because of unusually warm weather. Consequently, some part of the decline seen towards the end of the charted is to be expected. Nevertheless, even when these factors are taken into account the abrupt nature of the decline in consumption after the 23rd of March is obvious.
Furthermore, there is a clear loss of the familiar structure in the pattern of demand, a feature which is still more evident in the pattern of instantaneous load (MW) on the network by half-hourly settlement period. Compare the following two charts, the first of which graphs load from the 1st of January to the 24th of February, while the second charts the period from the 1st of March to the 23rd of April.

Figure 2. National Demand (the sum of metered generation excluding generation required to meet station load, hydro storage pumping and interconnector exports) by half-hourly settlement period from the 1st of January to 24th February (MW). Source: Chart by the author: National Grid data.

Figure 3. National Demand (the sum of metered generation excluding generation required to meet station load, hydro storage pumping and interconnector exports) by half-hourly settlement period from the 1st of March to 23rd April (MW). Source: Chart by the author: National Grid data.
Before the lockdown the pattern of load is highly but regularly variable, exhibiting repetitive periodicities on several timescales, all patterns well known to the grid operators. The second chart shows the regularly and highly differentiated pattern of electricity demand both falling and becoming temporarily more chaotic as it moves towards a new and less differentiated equilibrium at a lower level. This is not only new and unfamiliar territory for the system operators, but has accelerated the arrival of problems with the large and inflexible renewables fleets, problems for which the system is probably not quite ready.
National Grid ESO’s Summer Outlook for electricity, published on the 15th of April, puts a brave face on the matter, but cannot conceal the difficulties. The ESO's principal concern is a combination of low demand and a high proportion of inflexible or relatively inflexible renewable generation, leading to system balancing problems. Assuming that demand cannot be increased on request, the operator must prevent hazardous increases in voltage, by reducing generation, while at the same time maintaining sufficient inertia to preserve system stability.
There are already significant reductions in demand, and NG ESO’s medium impact scenario envisages these continuing into the summer with a demand reduction of 7% overnight and 13% during the day. The high impact scenario involves reductions of 13% overnight and 20% during the day. In fact, reductions approaching the high impact scenario are already being observed, with National Grid commenting that in April the UK electricity system served low loads not usually seen until the much warmer, holiday months of July and August. To illustrate this point the Summer Outlook provides a graphic comparing actual demand on the 14th of April with the demand that would otherwise have been expected.
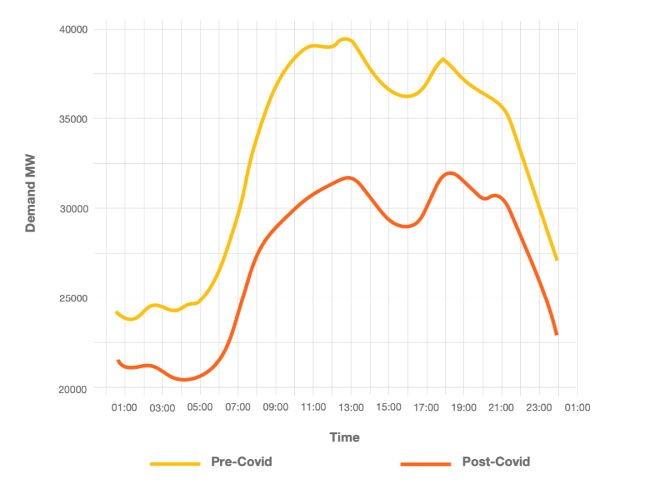
Figure 4: Demand (MW) predicted pre-Covid for the 14th April (yellow line), compared with actual demand (orange line). Source: NG ESO, Summer Outlook (April 2020), p. 6.
The largest demand fall in the chart appears to be in the order of 19%, and generally the currently observed reduction is, as NG comments, “between [the]‘medium impact’ and ‘high impact’ scenarios” considered in the Summer Outlook.
One might on that basis suspect that the summer impact scenarios are overly optimistic, but it is probable that National Grid is expecting the lockdown restrictions to be eased, keeping demand suppression within the bounds of its high scenario. If, on the other hand, the restrictions are maintained or even strengthened then the possibility of demand cuts exceeding 20% are clearly possible.
A reduction of approaching 20% on spring and summer demand poses real difficulties for control room operators, since they are now working with a generation fleet that is to a large degree non-dispatchable, 23 GW of wind and 12 GW of solar power for example, and may seek to provide energy to system even when not required. Table 2 of the Summer Outlook describes a maximum demand of only 25.7 GW in the high impact scenario, and a minimum demand of 15 GW, a minimum that has already been observed in April. In between these limits, the operator must retain sufficient conventional, rotating plant to provide stabilising inertia, but also find room if required for the 23 GW of wind and 12 GW of solar power, both uncontrollable.
Of the two, it is the solar fleet that is giving NG ESO the most cause for concern. About wind, they can afford to be relatively relaxed since, firstly, output tends to be low in the summer months, and, secondly, they have extensive experience of constraining wind off the system through the Balancing Mechanism (at a cost of £101 million so far this year). That said, it is highly significant that the Summer Outlook refers to the use of an additional instrument, namely “direct trade” (see p 15) to buy wind farms off the system. Bilateral trades of this kind with wind farms have not been used intensively for quite some time, and their return is a sure sign of emergency measures. It’s a topic to watch.
Solar, on the other hand, is a looming and novel difficulty for the ESO, now brought suddenly and alarming close. National Grid presents the following chart to illustrate the impact that embedded solar generation can have on transmission demand.

Figure 5: Impact of embedded solar generation on transmission system demand, Tuesday 4th June 2019 (red line, low solar infeed), and Tuesday 14th May 2019 (yellow line, high solar infeed). Source: NG ESO, Summer Outlook (2020), p. 11.
The Summer Outlook remarks of days described in this chart that:
“These two dates share similar temperature and embedded wind properties and were both Tuesdays – the only major difference was 7.5GW of embedded solar generation.”
The concern is that if a similar or greater event, up to the 12 GW maximum of solar installed, were to occur with only 15 GW of demand, there would be a real risk to the stability of the system. NG ESO sketches what it will do in this sort of event in three crucial sentences:
Similarly, when low demands coincide with high levels of renewable generation that is not synchronised with the grid, system inertia is lower meaning that the impact of any frequency events are greater. This is where our new inertia services are relevant and another reason why synchronous generation may be required to remain on the system. If demand levels fall close to the level of inflexible generation on the system, we may also need to issue a local or national Negative Reserve Active Power Margin (NRAPM). To date a limited number of local NRAPMs have been issued, but none at a national level. (Summer Outlook, p. 14.)
A Negative Reserve Active Power Margin warning is an indication that the ESO may need to give “Emergency Instructions” to a generator or generators to cease generating, even to the extent of having to trip off the system immediately and regardless of inconvenience or cost. It is a severe level of warning, and at a national level would indeed be unprecedented. What is not clear from this statement is how embedded solar sites, of which there are quite literally hundreds and thousands even of the larger size, would be taken promptly off the system by such an Emergency Instruction. The ESO will clearly have, as they say in the control room, a “difficult day”. It might be awkward for the rest of us, as well as expensive.