
Why record wind output is no cause for celebration
California recently produced more renewable electricity than it can use. Not for a year, nor even a day. Around 3pm on 8 May 2022, it produced so much renewable electricity that it amounted to 103% of total electricity demand.
Intermittent energy advocates viewed this as another positive milestone. Arguably, the milestone heralds more difficult times for wind and solar, or for us if governments keep trying to swim against this tide.
As renewable generation increasingly exceeds total demand, the network system operator has to curtail (i.e. turn down) intermittent output more. It started long before intermittents hit 100%, even momentarily, because the system needs some thermal generation for system services, and some non-renewable technologies, like nuclear, can’t easily be turned off. California has been curtailing wind and solar long before 8 May. But the amount of curtailment that is required is increasing rapidly (charts below based on data from the California Independent System Operator).
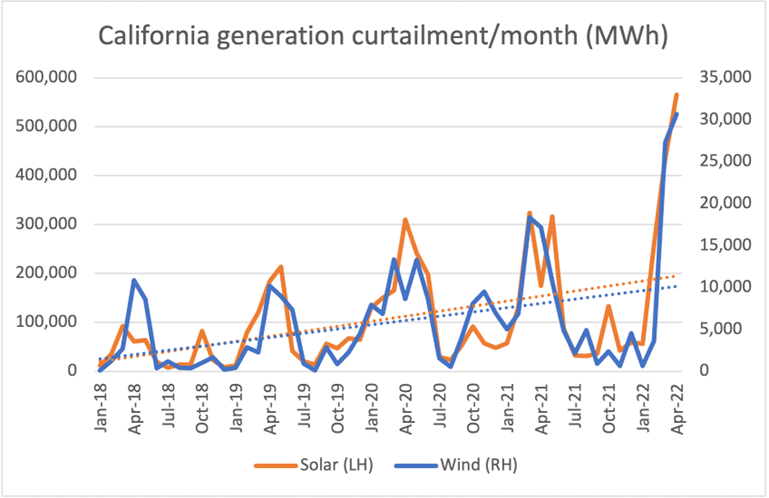
Renewable output is increasing, so you might expect the curtailed output to increase with it, even if there were no increase in the rate of curtailment.
But curtailment is increasing faster than renewable output. The following chart divides the amount of curtailment by the amount of generation, to calculate the proportion of wind and solar generation that had to be curtailed each month.
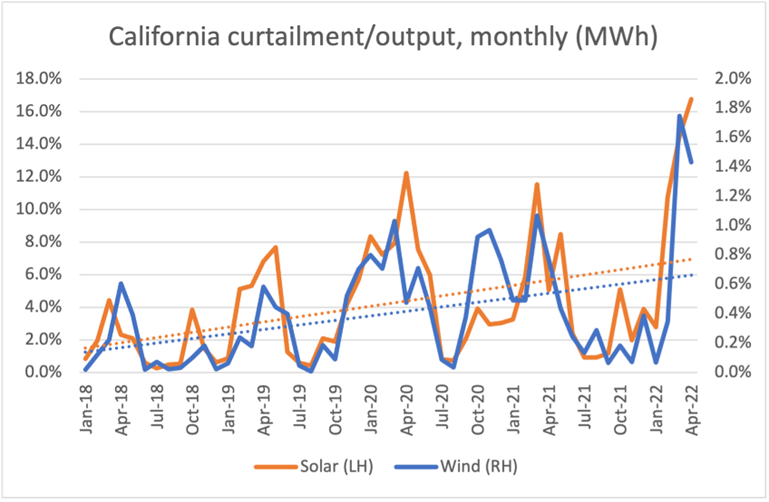
Once output approaches the demand curve, extra capacity pushes output over the demand curve more than the marginal capacity did in the past. Less of the extra generation is useful. The marginal utility of new wind and solar falls steadily once capacity reaches this point. Energy system models tend to underplay this factor relative to supposedly endless reductions in the manufacturing costs.
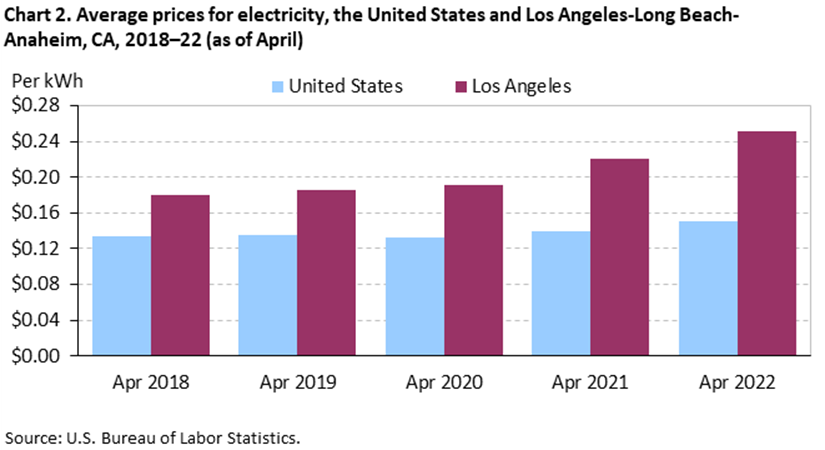
That is part of the reason why increasing proportions of (supposedly) increasingly-cheap wind and solar don’t seem to have the positive effect on prices that their advocates want us to believe they will have (chart from US Bureau of Labor Statistics).
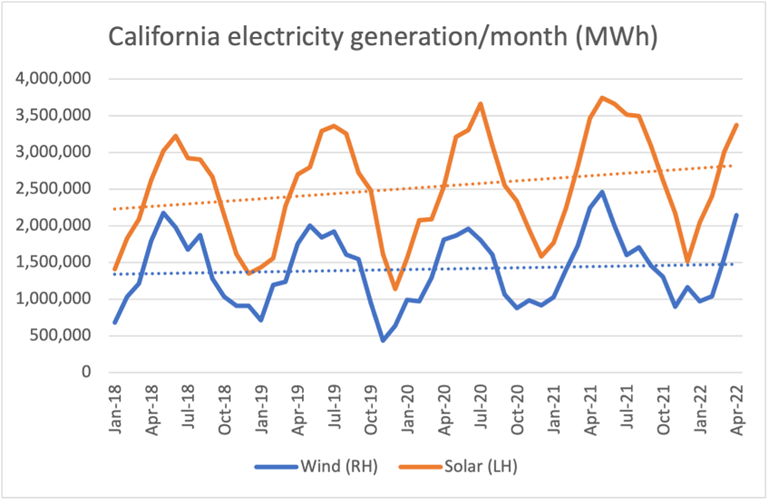
Momentary figures like 103% renewables on 8 May at 3pm give a misleading impression of the true contribution. The following chart compares the monthly demand (load) with the combined output of wind and solar.
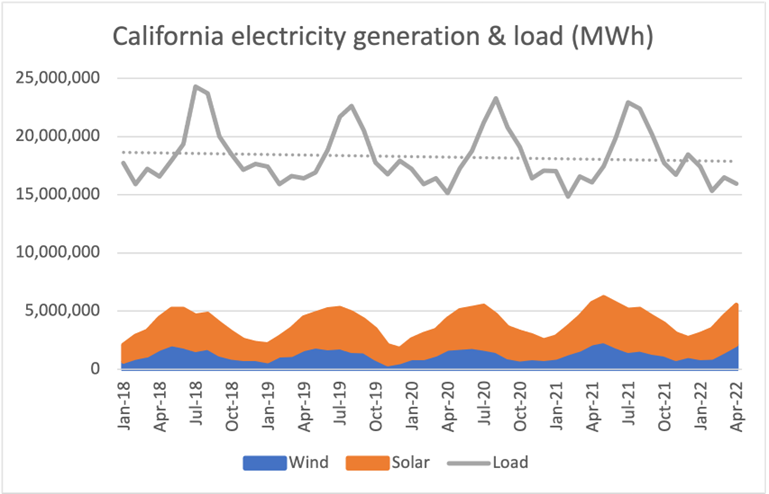
Demand is falling a little (not much electrification of transport and heat showing up yet). Wind and solar are rising a little. But over a year, rather than in an instant, wind and solar are contributing 24% of electricity supplies, or 30% including other renewables (except big hydro, which is treated as non-renewable in many official statistics, for no good reason). California is experiencing diminishing marginal returns while wind and solar are still less than a quarter of total supplies.
8 May was a Sunday. Demand tends to be low at the weekend. It was sunny and approaching the solar equinox, so solar output was high. And it was windy, which is also a function of warm, sunny weather where the wind is thermal. That this combination resulted in 103% renewables while the average is 30% tells us more about the problems of intermittency than about the triumph of wind and solar.
But at least this milestone means that renewables are gradually eliminating fossil-fired generation, right? Sadly not.
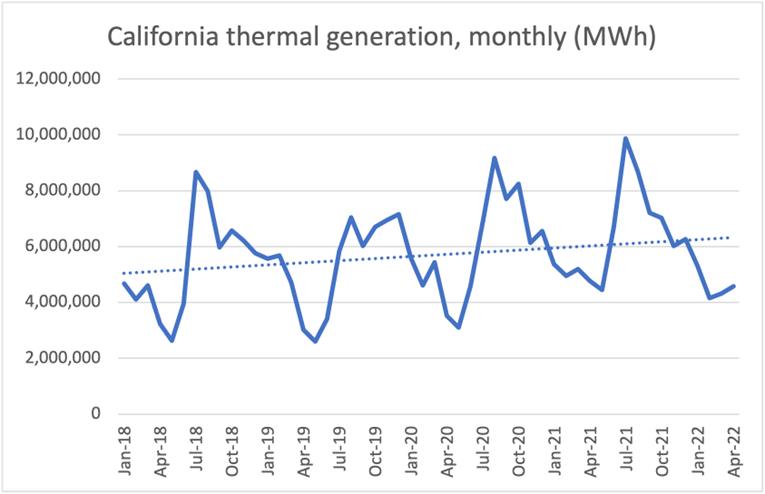
With electricity prices higher and rising faster than the US average, and fossil-fired generation increasing, the only reason to celebrate milestones like 100% renewables for a moment is if you are one of the successful rent-seekers that has invested in the technologies, or a lobbyist that views wind and solar as somehow virtuous in their own right, regardless of their effect on costs and decarbonisation.
California has advantages relative to the UK. It is nearer the equator so it enjoys higher solar load factors. And there is better correlation between renewable output and demand, because their peak demand is in summer for the cooling load, whereas the UK’s peak demand is in winter for the heating and lighting load. The problems that California is experiencing will be worse for us.